Microscopic analysis of Geometric and Orientalising finewares
Introduction
This article presents an independent pilot study of a small ceramic assemblage from the Athenian Agora, selected from the same contexts as the material discussed in the other articles, and analysed using three techniques: Hand Specimen examination (HS), Thin Section Analysis (TSA), and Scanning Electron Microscopy (SEM). This pilot project has two aims: firstly, to investigate whether the fabric variations identified macroscopically through hand specimen examination in previous chapters are the same as those identified using more sophisticated microscopic techniques. Secondly, to examine whether the developments in vessel forms, assembly proportions, and decorative technologies discussed earlier could also have required alterations in core manufacturing processes, such as clay selection and manipulation (levigation and tempering).
Microscopic analysis is conducted on 17 finewares, belonging to large ceramic containers, medium-sized pouring vessels and small drinking vessels (Figure 1). More specifically, the samples come from 5 amphorae, 3 oinochoai and 9 open vessels, either drinking cups or small-sized kraters. The material was offered for microscopic analysis by the American School of Classical Studies at Athens, and a sampling permit was obtained from the Greek Archaeological Services (permit reference: ΥΠΑΙΘΠΑ/ΣΥΝΤ/Φ44/64642/2881). All fragments come from wells and relate to mixed deposits, divided into four chronological groups:

The samples from deposit R17:5 come from the broader 7th-century BC period and are difficult to date precisely.


Figure 1: List of ceramic samples for microscopic analysis.
This article demonstrates that hand specimen characterisations match those under more sophisticated microscopic techniques. All tests confirm that Geometric and Orientalising finewares were produced from the same fabric, yielding the same two variants discussed in previous articles. Furthermore, a comparison of clay-pastes and coatings used in Geometric and Orientalising pottery production reveals that both materials had similar chemical compositions; however, there are indications that during the early 7th century BC, some painters may have used coatings of a different chemical composition than the clays used to produce the same vessels.
Hand specimen examination (H.S.)
In the fabric identifications discussed in other articles, hand specimen examination was conducted on broken or cracked areas of ceramic artefacts. In this project, hand specimen examination is conducted on fresh breaks using a 10X hand lens under artificial light. Fabric identification procedures are the same as the ones followed in the previous three chapters. According to the analysis, all 17 samples are produced from the same fabric, which comes in two variants: Variant 1 is the finest fabric, and Variant 2 is a slightly coarser, more calcareous version of Variant 1. Both variants are the same as the ones described in chapters 3, 4 and 5, and again, variant 1 is the most prevailing and used in the production of different wares across four chronological periods:

According to the pie chart in Figure 2, variant 1 comprises the majority of samples (76%). Only 4 of 17 samples belong to variant 2, which comprise 24% of the total assemblage.
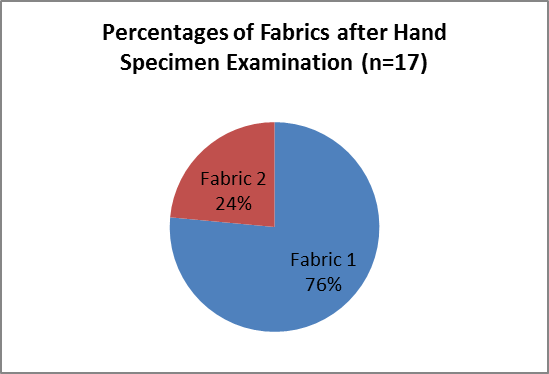
Figure 2: Percentages of fabrics after Hand Specimen Examination.
Thin section analysis (T.S.A.)
Even though there are different ways of describing thin sections and recording relevant information (e.g. Freestone 1987), a researcher’s choice depends primarily on the nature of his/her questions. Freestone (1995) summarises the issues assessed with the use of ceramic petrography, the main application of which is in the study of artefact provenance. In the present microscopic project, all artefacts have been identified as Athenian, and hand specimen examination has verified the presence of one major fabric used across different periods and in the production of different wares.
In cases where only one fabric is noted across a large geographical area, variations within this fabric can be established using simple methods based on the size, shape, and proportions of non-plastic inclusions (e.g., Peacock 1971). This form of textural analysis (sensu Freestone 1995, 113-4) is useful for the investigation of clay recipes in relation to different workshops producing pottery from the same clay (Middleton et al. 1985, 64; Freestone 1991, 405; Freestone 1995, 113-4; Darvill & Timby 1982; Streeten, 1982). Textural analyses are not always detailed -especially in fine fabrics- and should be supplemented with descriptions of clay micromass, groundmass and main inclusions based on their frequency of occurrence (e.g. Whitbread 1989). Freestone (1991, 401) argues that such analyses are time-consuming and not always comprehensible to non-experts; however, a characterisation based on texture and micromass is probably the best option for the finewares examined in this project.
The fabric descriptions below are presented according to the conventions established by Whitbread (1986; 1989). The abbreviations used are as follows: PPL = plain-polarised light; XPL = cross-polarised light; TCF = textural concentration features. The relationship c:f:v 0.125 mm refers to the percentages among coarse inclusions, fine inclusions and voids, and the inclusion diameter limit between coarse and fine grains set at 0.125 mm. Frequency labels: predominant >70%, dominant 50-70 %, frequent 30-50 %, common 15-30 %, few 5-15 %, very few 2-5 %, rare 0.5-2 %, very rare <0.5 %. Size of voids: mega >2 mm, macro 0.5-2 mm, meso 0.05-0.5 mm, micro <0.05 mm.
Descriptions of fabric variants
Variant 1 (Figures 3 and 4):
I Microstructure
(a) Dense microstructure; very few to rare meso and microvaughs, often with recrystallised infill of calcareous matter (marl or lime), most likely because of post-depositional conditions.
(b) Single or double-spaced porphyric-related distribution.
(c) Perfect parallel orientation to the vessel walls.
II Groundmass
- Homogeneous.
- Optically inactive. The colour ranges from yellowish-brown in PPL to dark red to brown in XPL (x40)
- Inclusions
c:f:v 0.125 mm = 20:77: 3- 14:85:1
The inclusions are very well to extremely well sorted with a clear unimodal distribution, ranging from angular to rounded.
Composition: No distinction is made between coarse and fine inclusions.
Common:
Monocrystalline quartz – predominantly very fine angular to rounded grains smaller than 0.05 mm. AS1816 (SOS amphora) contains only angular quartz grains.
Few:
Monocrystalline quartz - angular to sub-angular grains with sizes between 0.05 mm and 0.12 mm, often cloudy.
Lime – very fine grains of mixed angularity, smaller than 0.05 mm
Biotite and yellow mica laths between 0.02 mm and 0.25 mm.
Very few:
Iron ores – well-rounded or elongated mottles ranging between 0.2 mm and 0.35 mm; often mixed with angular quartz particles of silt size (AS1818, AS1819); sometimes large coarse and round particles between 0.3 mm and 1 mm forming agglomerates with silt-size quartz and exhibiting clear dehydration cracks (AS1813).
Schist – tabular, elongated fine or random-shaped coarse grains between 0.02 mm and 0.3 mm, containing smaller than silt size yellow mica, brown mica and quartz. Schist grains have merged margins and are very difficult to differentiate within the dense groundmass.
Lime – elongated and well-rounded, occasionally subrounded, with clear and rarely merged boundaries, sometimes occurring as scattered particles that have been partly burnt; range between 0.1 mm and 0.2 mm.
Rare:
Polycrystalline quartz – equigranular, between 0.05 mm and 0.2 mm.
Marl and quartz agglomerates – elongated or randomly shaped grains between 0.2 mm and 0.4 mm. They are probably naturally occurring grains of marl with angular or subangular quartz, perhaps related to rock formations near coastal regions (AS1817).
Very rare:
Feldspar – fine silt-size particles mixed with larger grains up to 0.1 mm, always altered from high firing temperatures. Very difficult to spot (AS1824).
III Textural Concentration Features
Tcf = between 1% and 5%
Few to rare, rounded clay pellets with clear or sharp to merging boundaries, neutral to low optical density and concordant orientation. Dark brown or black in PPL (x40), often dark brown with rounded black spots of 0.1 mm maximum diameter in PPL (x40), bright brown to red in XPL (x40). Constituents: The larger ones (between 0.35 mm and 1 mm) contain silt-size quartz, yellow mica needles, and often fine schist grains; all are medium to well-sorted and exhibit fine internal orientation. The finer and smaller clay pellets (between 0.2 mm and 0.35 mm) contain no inclusions. Exceptional cases are AS1816 (Late Geometric SOS amphora), AS1827 (Early Geometric open vessel, perhaps skyphos) and AS1829 (Early Geometric neck-handled amphora). They contain a few agglomerates (between 5% and 7%) that appear to be the same large clay pellets described above, mixed with concentrations of iron. The exact nature of these agglomerates could not be determined.

Figure 3: Variant 1 - Thin section of AS1826 (EG Oinochoe), 4X0.10 magnification, XPL.

Figure 4: Variant 1 – Thin section of AS1813 (PA Amphora), 4X0.10 magnification, XPL.
Variant 2 (Figures 5 and 6):
I Microstructure
(a) Dense microstructure; few to rare meso and microvaughs, often with recrystallised infill of calcareous matter (marl or lime), most likely because of post-depositional conditions.
(b) Single or double-spaced porphyric-related distribution.
(c) Perfect parallel orientation to the vessel walls.
II Groundmass
- Somewhat heterogeneous, with a variation caused by a combination of perhaps post-depositional recrystallisation and unequal distribution of marl particles below silt size.
- Optically inactive. The colour ranges from yellowish-brown with greyish zones in PPL to dark red to brown in XPL (x40)
- Inclusions
c:f:v 0.125 mm = 32:61:7 – 25:74:1
The inclusions are well sorted with a clear unimodal distribution, ranging from angular to subrounded.
Composition: No distinction is made between coarse and fine inclusions.
Common:
Monocrystalline quartz – rarely with undulatory extinction, predominantly very fine angular to sub-angular grains smaller than 0.05 mm.
Lime – predominantly very fine grains of mixed angularity, smaller than 0.05 mm
Marl and quartz agglomerates – elongated or randomly shaped coarse grains, very difficult to differentiate from each other. They often appear in distinct grain combinations and dense, random formations, creating the visual effect of zones along the fracture. They are probably naturally occurring grains of marl with angular or subangular quartz, perhaps related to rock formations near coastal regions (AS1820, AS1825).
Few:
Monocrystalline quartz - angular to sub-angular grains with sizes between 0.05 mm and 0.15 mm, often cloudy.
Schist – tabular, elongated or randomly shaped grains between 0.05 mm and 0.2 mm, containing smaller than silt-size yellow mica, brown mica and quartz.
Biotite and yellow mica laths between 0.02 mm and 0.2 mm.
Lime – elongated or rounded to subangular grains with merged boundaries and less commonly clear boundaries; often appear as scattered particles that have been partly burnt and exhibit irregular shapes; range between 0.1 mm and 0.4 mm.
Very few:
Iron ores – well-rounded or elongated, ranging between 0.05 mm and 0.1 mm; rarely mixed with angular quartz particles of silt size (AS1825). AS1828 (Early Geometric cup) is an exceptional case, containing iron-rich particles mixed with angular quartz and coarse lime.
Rare:
Polycrystalline quartz – equigranular, between 0.05 mm and 0.2 mm.
Very rare:
Feldspar – silt size, always transformed after firing.
III Textural Concentration Features
Tcf = between 5% and 10% (of the total field)
Few rounded clay pellets with clear or sharp merging boundaries, neutral to low optical density and concordant orientation. Dark brown or black in PPL (x40), often dark brown with rounded black spots of 0.1 mm maximum diameter in PPL (x40), bright brown to red in XPL (x40). Constituents: The larger ones (between 0.35 mm and 1 mm) contain mostly silt-size angular to sub-angular quartz, while sometimes yellow mica needles and fine schist grains; all are medium to well sorted and exhibit fine internal orientation. In very few cases, large-sized clay pellets contain no inclusions. The finer and smaller clay pellets (between 0.1 mm and 0.35 mm) contain no inclusions at all.

Figure 5: Variant 2 – Thin section of AS1820 (PA Kotyle or Skyphos), 4X0.10 magnification, XPL.

Figure 6: Variant 2 – Thin section of AS1825 (MG Amphora), 4X0.10 magnification, XPL.
Conclusions of Thin Section Analysis
Thin-section analysis verifies that all samples are made of the same fabric, a mixture of sandy sedimentary clay and marl. This fabric matches the geological composition of the area around the Athenian Agora (Gaïtanakis 1982), which comprises the Cretaceous Athenian ‘schist’ and other Quaternary sediments. The Athenian ‘schist’ is not a typical medium-grade metamorphic rock as is commonly described in geology; instead, it is a lightly metamorphosed sedimentary rock that has not been fully transformed to schist or gneiss.
This typical Athenian fabric ranges from very fine to extremely fine depending on its levigation, and is encountered in two variants (Figure 7) that differentiate according to their calcareous content: Variant 1 is tempered at a maximum of 10% with lime or marl, and Variant 2 contains lime/marl up to a maximum of 15%. The presence of different concentrations of lime or marl in this fabric could indicate three possibilities:
- Lime/Marl was a naturally occurring temper in Athenian clays and was found mixed with other sedimentary and/or metamorphic clays in varying proportions. This possibility is also in accordance with the local geology of Athens (Gaïtanakis 1982).
- There might have been different levigation techniques employed by the potters to control the amounts of calcareous inclusions in their clays. In that case, fabric variations are possibly due to different fabrication strategies.
- Some ancient potters purposely quarried clays that contained more lime/marl than the typical clay used in Athenian fineware production, selecting from specific locations around local clay beds. In that case, fabric variations result from different quarrying strategies. It is also likely that one of their sources was located closer to the coastal regions.

Figure 7: Comparison of fabrics under Hand Specimen and Thin Section. KEY: e.f.(=extremely fine), H.S. (=Hand Specimen), T.S.A. (=Thin Section Analysis).
In relation to their fabrication, neither of the two variants contains real coarse tempers (e.g. grog or other large aplastic rock fragments). As noted in Figure 7, large Late Geometric neck-handled transport amphorae of the SOS class are made from the same fabric as medium-sized pouring vessels and small drinking cups. In general, tempering fine clays with coarse inclusions (especially grog) increases the mechanical strength of pottery, particularly for vessels that are required to be durable to external mechanical shock (Skibo 1992; Rice 2005, 354-63). Transport vessels are more likely to carry such temper than serving or drinking vessels. In the case of Athenian Geometric and Orientalising finewares, however, this is not the case. It is more likely that ancient Athenian potters knew and trusted the quality of local clays, which performed equally well without coarse temper. The quantities of fine aplastic inclusions naturally mixed into local clays (e.g., quartz) would increase the hardness and durability of such fabrics, especially if fired at temperatures above 850 °C (Kilikoglou et al. 1998).

Figure 8: Percentages of fabrics after Thin Section Analysis.
Figure 7 also shows that the samples that were identified to belong to variants 1 and 2 after hand specimen examination match almost perfectly with those characterised as the same variants under thin section analysis. More specifically, four samples (AS1820, AS1815, AS1825, and AS1828) have been successfully identified as variant 2 using both techniques, while 12 samples have been identified as variant 1. It is only one of 17 samples, AS1818, which was characterised as variant 1 under hand specimen examination, yet it was found to belong to variant 2 under thin-section analysis. This misinterpretation is due to the dense texture of Athenian clays, which does not always allow clear identification of very small inclusions such as lime particles below silt size, particularly under low magnification (10X); therefore, hand specimen examination may not always be accurate. Still, it can be argued that both techniques yield the same characterisations, and the results from hand specimen examinations are the same as those from thin-section microscopy. According to the pie chart in Figure 8, thin-section analysis shows that the most frequent fabric is variant 1 (71%), while 29% of the samples belong to variant 2.
Scanning Electron Microscopy (S.E.M.)
Analysis of ceramic pastes
SEM-EDX analysis of polished cross sections was conducted on 16 out of 17 samples from the Athenian Agora (Figure 9). Spectra were acquired at four areas along the surfaces of the cross sections (Figure 10), and all readings were normalised and calculated as oxides. AS1820 could not be analysed using this technique due to the small sample size extracted from the original sherd, which was sufficient only for thin-section microscopy.

Figure 9: Comparison of fabrics after Hand Specimen examination (H.S.), Thin Section Analysis (T.S.) and Scanning Electron Microscopy (S.E.M.).
According to the mean oxide concentrations presented in Figure 9, the first thing to notice is the homogeneity of all samples with regard to their sodium, magnesium, aluminium, silicon, potassium, titanium, chromium, manganese, iron and nickel oxides. The similarities among these concentrations verify the existence of a single fabric used in Athenian Early Iron Age fineware production, which was also typical across four chronological periods. At the same time, SEM-EDX analysis verifies the existence of at least two variants of this fabric based on mean CaO concentrations. Variant 1 contains CaO up to 10%, while the same concentration in variant 2 exceeds 10%.

Figure 10: Example of polished cross-section of AS1817 under SEM-EDX showing the microstructure of the vessel’s paste (500X magnification).
Figure 9 shows that only 4 of the 16 samples produced from Variant 2 are AS1818, AS1815, AS1825, and AS1828. All the remaining samples have been produced from variant 1, which is the most dominant. According to Figure 11, Variant 1 accounts for 75% of the assemblage, whereas Variant 2 accounts for 25%. Furthermore, all samples identified as variants 1 or 2 under SEM-EDX match the same characterisations observed under thin-section analysis (Figure 9). The comparison shows that both techniques point towards the same results.

Figure 11: Percentages of fabrics after SEM-EDX analysis.
Analysis of coatings and paints
In the previous articles, the analysis of decorative technologies was based on simple colour descriptions and identification of slip or coating quality through macroscopic examination. In this pilot project, the coatings and paints on six decorated samples were initially recorded macroscopically using the same conventions as in previous articles (Figure 12). Then, the same decorative features were analysed under SEM-EDX microscopy to investigate their chemical composition. SEM-EDX analysis was carried out at four points along the external surfaces of the samples’ cross-sections (Figure 13), and all spectra were normalised and calculated as oxides, as in the analysis of pastes.

Figure 12: Decorative/technological characteristics of six test samples.

Figure 13: Example of polished cross-section of AS1818 under SEM-EDX showing an internal coating covering the vessel’s paste (500X magnification).
According to the chart in Figure 12, the six samples have been decorated with colours belonging to three groups: black (Group 1), brown/red (Group 2), and orange (Group 3). Thick internal coatings survive in four open-shaped vessels, while two carry only external decorative elements. This small assemblage is suitable for microscopic investigation of decorative technologies, as it represents the most typical colour ranges and external treatments encountered during macroscopic examinations of other articles.

Figure 14: Mean oxide concentrations (%) of coated/painted surfaces under SEM-EDX.
SEM-EDX analysis in Figure 14 shows that all samples have been decorated with iron-rich paints/coatings, with iron oxide content exceeding 13%. Despite their colour variations, the chemical composition of paints/coatings remains the same: they are clay-based substances with high silica and aluminium oxide contents, refined or enriched to contain high levels of iron (also see Tite et al. 1982).
Figure 15 compares the chemical compositions of paints used for decorative elements or slips/coatings with those of clay pastes for the same samples. The comparison suggests that mean iron oxide concentrations in painted/coated areas are significantly higher than those in vessel pastes. Sample AS1821 is exceptional and requires further investigation. This sherd comes from a 7th-century BC krater or dinos and has been treated with a coating that contains the highest concentrations of iron and magnesium oxide in the entire assemblage.

Figure 15: Comparison of mean oxide concentrations in slips/coatings/paints and pastes.
Furthermore, Figure 15 shows that all five Geometric samples have been painted or coated with materials of compositions similar to those of their pastes. In general, potassium and aluminium oxides appear in larger concentrations in the coatings/paints than in the pastes of these sherds. By contrast, titanium, calcium, silica, magnesium, and sodium oxides appear at lower concentrations in their coatings/paints than in their pastes. The Protoattic sample AS1821 follows a different pattern. Even though iron oxides are found in larger concentrations in their slip, all other elements exhibit the exact opposite pattern compared to those from the Geometric period.
This observation raises several interesting questions about Protoattic pottery. Firstly, has the coating of AS1821 been fabricated differently compared to Geometric coatings, and does this relate to a distinct 7th-century BC technological practice? Secondly, was its coating produced from the same clay as the vessel’s paste, using a different levigation technique, or was it made from a different clay source? To answer these questions, it is necessary to conduct further analysis on a larger assemblage of Protoattic sherds in the future.
Discusion
Clay composition and provenance
This section discusses issues of provenance in relation to the composition of Athenian clays by combining data from previous publications. A main problem encountered in such comparisons is that previous studies used different analytical techniques from those in this project, and they also addressed different questions about the nature of Attic clays. This section focuses primarily on the results of Thin Section Analysis.
According to the present analysis, all Athenian Geometric and Orientalising finewares have been produced from the same fabric, a mixture of a fine sedimentary clay and a fine lime-rich clay (most likely marl). This fabric comes in two variants that differ by the size of their ‘coarse’ inclusions (mainly clay pellets and iron) and by their calcareous content. Variant 1 is finer and less calcareous (up to 10%), while variant 2 is slightly coarser and more calcareous than variant 1 (above 10%). Despite some difficulty in identifying these two variants under Hand Specimen examination, Thin Section Analysis and Scanning Electron Microscopy confirm their correct identification.
Previous studies on Attic fabrics have discussed the existence of at least four clay sources exploited by Athenian pottery workshops: the ‘Amaroussi’ clays, located in the modern municipality of Marousi (circa 11.5 km Northeast of the Athenian Agora); the Iera Odos clays (also known as Sacred Way) located less than 1 km from the Athenian Agora; the cape Kolias clays, located at the area of Agios Kosmas (circa 9 km South of the Athenian Agora); and the Koukouvaounes clays, located in the modern municipality of Metamorphosi (circa 10 km North-Northeast of the Athenian Agora) (Noble 1966; Farnsworth 1970; Gautier 1975; Fillieres et al. 1983; Jones et al. 1986, 150). The source of Iera Odos is closest to the Agora production site, as suggested by Papadopoulos (2003), from which the present 17 samples derive.
Farnsworth (1970) described the Iera Odos clays as white and fine-textured, by contrast to the red fine-textured clays from the source of Amaroussi. In an analysis of two modern clay samples from these two sources using X-Ray Diffraction (XRD), Farnsworth (1970) characterised the red Amaroussi clays as illitic and relatively free of non-clay minerals (1). Even though red clays were described as ideal for black glazed pottery, Farnsworth (1970, 17) explained that their high degree of shrinkage would have made it difficult to work with; therefore, Athenian potters would need to mix red clays with white clays such as those from Iera Odos, which contained large quantities of chlorite and montmorillonite together with illite. Of these constituents, chlorite is non-plastic with a high degree of crystallinity, and therefore visible under X-Ray Diffraction (XRD).
The microscopic techniques discussed in the present article were designed to trace minerals based on their optical properties through Thin Section Analysis or chemical composition through Scanning Electron Microscopy (Rice 2005, 379-82, 401-2; Pollard et al. 2007, 118-20). By contrast, X-Ray Diffraction, used by Farnsworth (1970), is suitable for identifying crystalline structures within the clay matrix (Rice 2005, 382; Pollard et al. 2007, 120); thus, the technique is more relevant to a discussion of shrinkage and plasticity. In the present Thin Section Analysis project, the main constituent mineral in all samples is fine-grained quartz; therefore, the typical Athenian fabric is described as sedimentary rather than illitic, despite the frequent presence of micas under thin section. Farnsworth (1970, 17) explains that quartz is normally encountered in such samples; however, its peak would be obscured by the illite peak in X-ray diffraction for both red and white Athenian clays.
Due to the use of different microscopic techniques, this project could not verify if the clays used in Geometric and Orientalising fineware production match the Amaroussi or Iera Odos sources, or if they are a mixture of both. In general, the fracture colour of Geometric clays is 5YR 7/3 and 7/4; therefore, they are neither white nor red, as the modern clay samples examined by Farnsworth (1970). Again, colour variations are due to factors such as tempered inclusions (particularly iron- or calcium-rich), firing temperatures, post-depositional deterioration, and, finally, human perception (Rice 2005, 331-46); hence, they are subject to bias.
An earlier study by Farnsworth (1964) included Thin Section Analysis on a few Archaic coarsewares from Athens. These belonged to a different typological class and chronological period compared to the 17 samples that were thin-sectioned in this project. The main rocks present in Archaic coarsewares were quartzite and schist. Quartzite grains consisted of smaller interlocking grains of quartz, feldspars, and micas up to 10%. Schist fragments consisted of quartz, feldspars, biotite and dominantly muscovite mica. Quartz and feldspar grains found in Athenian coarse pottery were often strained, which is characteristic of metamorphic rock formations. Additionally, there were heavy minerals associated with aluminium silicates, such as sillimanite, kyanite, and staurolite, which are characteristic of metamorphic parent rocks (Farnsworth 1964, 223). According to Farnsworth (1964, 223), this geological content was common to both the Amaroussi red clays and the Iera Odos white clays. Quartz appeared to be a natural temper instead of artificial, and the finer versions of Athenian clays were refined in such ways that only the finest inclusions remained present (Farnsworth 1964, 223). The 17 Geometric and Orientalising samples that were thin-sectioned in this project have a similar geological composition to the Archaic coarseware samples analysed by Farnsworth (1964); however, they have been levigated to remove large, coarse, and non-plastic tempering materials such as schist, feldspar, and quartzite. In all 17 samples, fine schist and polycrystalline quartz are rare inclusions, while feldspars are almost absent or very difficult to identify due to alterations related to firing.
One of the finewares examined by Farnsworth (1964, 227) was a rim from a 5th-century BC stemless cup, designated sample 13. Its thin section showed a well-settled fabric, which still retained some characteristically Athenian impurities, particularly fine flakes of muscovite (sericite). All inclusions showed good orientation due to the fast wheel (Farnsworth 1964, 227). The thin section of Farnsworth’s sample 13 (1964, pl.68) matches the majority of thin sections presented in this project. It appears likely that Athenian finewares underwent thorough levigation and that their texture remained very fine throughout the Geometric and Orientalising periods. The same levigation techniques probably continued until Classical times. The only marked difference between the samples examined by Farnsworth (1964) and those analysed in this project is that the former have not been described as calcareous. It is highly unlikely that Farnsworth’s samples contained no calcareous inclusions at all, as marls are common in the geology of Athens (Gaïtanakis 1982). Instead, it is more likely that such clays were purposely quarried or levigated to contain a minimum of calcareous tempers. All Geometric and Orientalising finewares analysed in this chapter were found to contain significant quantities of calcium carbonate in their paste, likely due to specific levigation or quarrying practices during the chronological periods under examination.
Gautier (1975) analysed ten Late Geometric vase samples of the ‘Dipylon style’ from the Louvre Museum (mainly burial amphorae) with the use of Thin Section microscopy. Her study revealed that the Dipylon fabric, denoted as Type M, was a deliberate mixture of red plastic clay and marl (Gautier 1975, 43-4). Her thin-sections LM32 and LM33 (Gautier 1975, pl. 3) correspond to Variant 2 in this project. Apart from calcareous inclusions, Gautier’s Fabric M contained abundant and well-sorted quartz and mica (Gautier 1975, 29). Such inclusions were also typical in other Athenian fabrics presented in her study from the Orientalising period: samples LM43 and LM53 (Gautier 1975, 37-8, p.1-2), denoted as Fabric C, were made from dense argillaceous clays, abundant in fine quartz and mica. The same exact inclusions characterise all Geometric and Orientalising samples examined in this project.
According to Gautier (1975, 53-6), the production of Athenian Late Geometric finewares made from Fabric M was destined for limited local consumption. The paste of Fabric M was a deliberate mixture of two clays, one argillaceous and one calcareous. Late Geometric production was followed by that of the 7th century BC, which exhibited features of experimentation: potters produced vessels from clays with different, though geologically neighbouring, tempers, which differed only in relation to sorting (e.g., Fabrics C and D) (Gautier 1975, 53-6).
This study shows that the use of mixed clays was neither limited in the Late Geometric period nor restricted to the production of burial amphorae. Furthermore, SEM-EDX analysis suggests that the chemical composition of Attic clays did not exhibit large variation in CaO concentrations; therefore, it is difficult to say that some vessels were deliberately tempered with more marl than others. By contrast, it is highly likely that these clays were naturally mixed in the local geological beds close to the Athenian Agora, matching perhaps Farnswoth’s (1970) white clays of Iera Odos. The presence of lime and quartz agglomerates noted in samples of variant 2 under thin section could also mean a simultaneous exploitation of coastal clays between the 9th and 7th centuries BC, matching perhaps Gautier’s sample from Cape Kolias (1975, 55-6).
Whatever the case, the mixing of different clays as a conscious fabrication practice, leading to the existence of different clay recipes, could neither be proven nor ruled out. Instead, it is more likely that Athenian potters' technological choices involved different quarrying and refinement strategies rather than clay-mixing practices. This explanation also aligns with Liddy’s (1996, 488) observations, who noted that Attic fabrics resolved into multiple composition groups across different chronological periods (see the next section). His possible explanations included the exploitation of similar clay beds, the wide natural variation in clay compositions within the same region, and the effect of different potters’ practices in preparing the clay (Liddy 1996, 488-9).
Distinctiveness of Athenian fabrics
It is important to clarify that Athenian Geometric and Orientalising fabrics are characteristically different from the fineware fabrics used at other Early Iron Age production sites. Because of the nature of this pilot study, comparisons of texture fineness and inclusions across different fabric groups can be made only through Thin Section Analysis, as this is the only technique capable of revealing such information.
Thin sections of Protocorinthian aryballoi of the middle 7th century BC show that the white clays of Arcocorinth look equally settled and fine-grained as Athenian clays; however, they contain large inclusions that are typical in highly calcareous sources (e.g. shale), which are not encountered in Athens (Farnsworth 1970, 11-12). Furthermore, other Corinthian finewares produced from red or white clays from Acrocorinth, even those from Classical and Hellenistic times, retain large, coarse inclusions such as quartzite, schist, and spotted shale (Farnsworth 1970, 9-13). Again, such inclusions are not encountered in Athenian Geometric and Orientalising finewares, even though fine schist has been noted in Athenian Archaic-period coarse wares (Farnsworth 1964).
The study by Whitbread (1995) on Greek transport amphorae, using Thin Section Analysis, has shown that the typical Archaic fabrics contain large aplastic inclusions and coarse tempers. Archaic Corinthian amphorae, for example, contain large and coarse grains of mudstone, which are characteristic of the local geology. By contrast, the fine fabric of the early SOS transport amphora AS1816 from the Athenian Agora is unusual for the production of such vessels. The present study shows that its thin section is closer to the Athenian fabrics used for Classical decorated finewares noted by Gautier (1975).
A recent analysis on Early Iron Age fabrics from Knossos (Boileau & Whitley 2010) shows that the local fabric for painted semi-finewares and finewares bears similarities with the Athenian variant 1. More specifically, the fine Knossian fabric of Group 6 was used continuously in pottery production from the transition between the Subminoan and the Early Protogeometric period, until the Early Orientalising period. This span extends over more than four centuries (Coldstream 1968, 330-1). The preference for this fabric must have followed a strong technological tradition similar to that noted in Early Iron Age Athens. Furthermore, the typical Knossian fineware clay is sandy, containing the highest amounts of fine, rounded monocrystalline quartz of any local fabric. Biotite mica is frequent, and clay pellets with merging boundaries are common to rare (Boileau & Whitley 2010, 249-52). Such fine inclusions are also typical of both Athenian Geometric and Orientalising variants; however, the Athenian texture is denser, with fewer voids,, and the micromass is not mottled, unlike that of Knossian finewares. Furthermore, Knossian clays carry very few to absent grains of chert, calcimudstone, sandstone and serpentinite (Boileau & Whitley 2010, 249-52). Again, these inclusions are not encountered in Athenian clays.
The Athenian Variant 1 shows similarities to a fabric of possible Euboean origin from Knossos, KN70 (Boileau & Whitley 2010, pl.3f). KN70 comes from an Orientalising SOS transport amphora, which has been stylistically identified as Euboean. Its fabric is definitely not the same as the one from the Attic Early SOS transport amphora AS1816, even though it resembles: both pastes are characterised by fine and well-sorted silicate inclusions; however, the Euboean fabric contains dark grey clay pellets set in a dark red groundmass (Boileau & Whitley 2010, 236).
Finally, the Athenian variant 2 shows characteristic similarities with a Cycladic fabric from Knossos, KN24 (Boileau & Whitley 2010, pl.3a). KN24 is made from calcareous-rich clay with frequent mica laths and sub-rounded monocrystalline quartz grains (Boileau & Whitley 2010, 235). It resembles the Athenian variant 2 in terms of density and inclusion quality, although it is probably more calcareous.
Despite some fabric similarities among Attic, Knossian, Euboean and Cycladic finewares, the present pilot study shows that Athenian production was favoured by high-quality clay resources, which made Athenian fineware fabrics distinct.
Geometric and Orientalising pastes in relation to the pastes of other periods
This section compares the results of the present SEM-EDX study with previous elemental analyses, with particular interest in fluctuations in CaO and Fe2O3 content (2). The aim is to investigate possible chronological patterns in the clay recipes used in Attic/Athenian fineware production, an issue first suggested by Gautier (1975) and Liddy (1996). It must be clarified that such comparisons can be misleading due to differences in laboratory standards used for analytical techniques (SEM, OES, NAA, etc.) (Liddy 1996, 478). The results discussed in this section must be treated with caution.
According to the mean oxide concentrations for 16 samples from the Athenian Agora grouped in four chronological periods (Figure 16), the typical clay in Geometric and Orientalising fineware production contains SiO2 between 54.1% and 55.2%; Al2O3 between 16.1% and 16.7%; MgO between 4.9% and 5.3%; CaO between 8.4% and 9%; Fe2O3 between 9.1% and 10.4%; and finally, other oxides in low percentages. Figure 118 also suggests no distinct pattern in the chronological period of these samples.

Figure 16: Mean oxide concentrations of 16 samples under the SEM, divided into chronological groups.
This observation is, by contrast, different to Liddy’s (1996) study on Attic Geometric imports from Knossos North Cemetery with the use of Atomic Absorption Spectroscopy. His study showed the presence of two distinct composition clusters that belonged to specific chronological periods: cluster 3/4 contained predominantly Protogeometric to Middle Geometric samples (10th and 9th centuries BC), and cluster 3/5 contained Middle Geometric to Late Geometric samples (8th century BC) (Liddy 1996, 478). Liddy’s comparison of mean concentrations of Ca between clusters 3/4 and 3/5 showed that the Middle to Late Geometric cluster 3/5 contained larger amounts of Ca (8.42%) compared to the Protogeometric to Middle Geometric cluster 3/4 (3.19%) (Liddy 1996, 508, table 7). By contrast, SEM analysis conducted in this project shows that mean CaO concentrations appear to be relatively steady across four chronological periods (Figure 16).
This absence of chronologically distinct fabric groups could be due to the different nature of SEM-EDX microscopy compared with Atomic Absorption Spectroscopy used by Liddy (1996), or to the small sample size in this study. However, Liddy (1996, 476) notes that his clusters 3/4 and 3/5 could be a similar cluster in the data space, and one needs to be cautious because of some uncertainty regarding the true origin of some samples. It is more than likely that the study by Liddy (1996) included vessels of broadly Attic provenance, whereas this study includes only vessels from the Athenian Agora. The existence of production centres in Attica, which exploited clay sources with higher CaO content than the typical Athenian clays, has already been noted by Boardman & Schweizer (1973, 270) with regard to an Attic Archaic sample from Perati. In this regard, the results of the present study need to be compared with those of previous studies focused solely on Athenian finewares.
The study by Fillieres et al. (1983), using Neutron Activation Analysis on a group of test pieces, figurines, and potsherds from the Athenian Agora, showed three chronologically distinct fabric groups: the Classical and Hellenistic Group A, the Protogeometric Group B, and the Subgeometric Group C. The study did not include any material from the Geometric period. The differences among these three groups of Attic clays meant that: “…either separate clay sources were used during each of these periods or that some other significant changes in the traditions of fabrication had occurred” (Fillieres et al. 1983, 62).
During this study, a modern clay sample from Cape Kolias matched the Subgeometric Group C (Fillieres et al. 1983, 61). Group A failed to match the sample from Amaroussi, which, according to textual sources, was supposed to be the clay source of Classical Attic pottery production (Fillieres et al. 1983, 61).
The concentrations of CaO and Fe2O3 offered by Filliere et al. (1983, 61) after Neutron Activation Analysis are the following:

According to the study by Boardman and Schweizer (1973, 270) on 6th-century BC Athenian workshops with the use of Optical Emission Spectroscopy, the same oxide concentrations for the Archaic period are:

Finally, the study by Prag et al. (1975, 170, fig.5a) on Athenian Hellenistic black-glazed finewares offers the following oxide concentrations:

In a comparison of the above data and the means presented in Figure 118 after the present SEM-EDX analysis, mean calcium and iron oxide concentrations show the following chronological patterns:

According to fluctuations in calcium oxide levels, there appears to be a gradual decline in the use of calcareous fabrics in Athenian fineware production from the Protogeometric to the Hellenistic era, interrupted only by the production of Subgeometric wares. Subgeometric pottery is the most calcareous of all chronological groups. Furthermore, iron oxide fluctuations do not follow any distinct chronological pattern; however, Subgeometric pottery is distinct, with the lowest iron oxide percentages.
It is important to clarify that there is no such thing as a Subgeometric period; the term refers to a ceramic style of the Geometric period that continued to be produced in the early 7th century BC. High concentrations of calcium oxide in Subgeometric pottery, in conjunction with low iron content, can be explained by a preference for more calcareous clays during the production of this ceramic style. This practice probably declined together with the Subgeometric style in the following periods.
As explained earlier, comparisons of element concentrations obtained with different analytical techniques must be treated with caution. Based on the fluctuations in calcium oxide across different chronological groups, there are two possible explanations. Firstly, it is likely that earlier Iron Age Athenian pottery production exploited clay sources with higher calcareous content than later times. Secondly, clay levigation techniques gradually improved from the Protogeometric to the Hellenistic period, resulting in less calcareous fabrics. Subgeometric pottery is exceptional and likely represents a conscious choice by potters to produce finewares from the most calcareous clays available. The reasons why this occurred are unfortunately unknown. Experimentation could be a possible explanation; however, this must be addressed in another microscopic project that includes sufficient Subgeometric material.
Paints, slips, coatings and pastes
This section discusses the results of Scanning Electron Microscopy on the chemical compositions of pastes, slips, coatings, and paints. Discussion is based on previous studies that examined the crystalline and microstructural features of these features using other analytical techniques. The aim of this section is to elucidate to what extent colour and quality of external treatments were due to the chemical compositions of paints, slips and coatings.
Figure 14 shows that the chemical compositions of paints and slips/coatings on decorated finewares, as determined by SEM-EDX, are similar regardless of colour or external appearance, as shown in Figure 12. The decorated areas of the five Geometric samples exhibit higher concentrations of iron and aluminium oxides and lower concentrations of silicon oxides than their pastes (Figure 15). One Protoattic sample (AS1821) stands out: its coating shows the highest readings for iron, silicon, calcium, titanium, and magnesium oxides, and the lowest for aluminium oxide, compared to any other sample (Figure 15). The decoration of this sherd differs from that of its Geometric counterparts and is highly likely the result of a different technological choice. This technological choice should be attributed to the painter who decorated it, as the potter who made it used the same typical Athenian clay as the other samples, which matches the pastes of all other samples. In that sense, AS1821 could demonstrate that the division of labour between potters and painters in Orientalising workshops was not only present but also defined by a distinct range of technological choices. As the sample is too small to produce certain conclusions, this suggestion must be treated with caution.
The paints of Attic Classical pottery have been studied using Scanning Electron Microscopy, Optical Microscopy, Electron Microprobe Analysis, and X-Ray Diffraction by Tite et al. (1982). Their study demonstrated that the paint of Attic vessels was likely produced by refining the same clay used for pastes, by extracting its heavier impurities through dissolution and suspension in water. The composition of the typical Attic paint, described as intentionally red or black gloss, was found to contain higher aluminium-to-silicon ratios, higher percentages of iron oxide, and lower levels of magnesium and calcium oxides than the typical Athenian paste (Tite et al. 1982, 121). In terms of mineralogy, the black gloss of Attic finewares contained a spinel of magnetite-hercynite (Fe3O4 – FeAl2O4) and the red gloss was identified to contain hematite (Fe2O3). By contrast, the paste used for the body of the vessels contained a combination of hematite, quartz, anorthite, diopside/wollastonite, and ghelenite (Tite et al. 1982, 121). The present SEM-EDX analysis of pastes and coatings/slips confirms the same observations regarding the ratios of aluminium, silicon, iron, magnesium, titanium, and calcium oxide; however, only for the Geometric samples.
The quality of 4th-century Attic glosses has also been examined using X-ray diffraction by Marie Farnsworth (1970). According to Farnsworth: “…besides possessing a clay high in illite which made a glossy black glaze, the Athenians used the same red clay (modified by less plastic white) for the fabric, and this assured an ideal condition for glaze adherence” (Farnsworth 1970, 19).
This suggestion explains why Athenian potters could not use completely different clays with significant differences in their mineral constituents, one for the paste and another for the gloss. It must be noted that the black gross described by Tite et al. (1982) and the glossy black glaze according to Farnsworth (1970) are exactly the same as the thick lustrous coatings described in this thesis.
According to the study by Tite et al. (1982), the chemical composition of Attic paints was similar across different wares, resulting in glossy external appearances in black or red colours. The intentionally red or black gloss on the vessels’ surfaces could have resulted in a single firing cycle divided into three steps: oxidised, reduced and re-oxidised (Tite et al. 1982). Noble (1960; 1966) suggested that the firing cycle of Attic red-figured and black-figured wares was divided in four steps instead of three: (1) firing under oxidised conditions up to 800 C; (2) firing under reduced conditions between 800 C and 945 C; then, followed by cooling up to a temperature of 900 C - or perhaps 875 C (in Noble 1960, 318); (3) re-oxidised firing at 900 C -or perhaps 875 C as explained in Noble (1960, 318); and (4) gradual cooling in oxidising conditions until the vessel was removed completely from the kiln (Noble 1966, 167). Whatever the case in Classical Athens, the test pieces recovered at the Athenian Agora (Papadopoulos 2003) suggest that kiln control was most likely similar -if not the same- in Attic Early Iron Age pottery production.
In the present study, it is more likely that the decorative colours and external appearances recorded macroscopically using simple conventions were achieved through different firing combinations. Variations in temperature (3) and duration of the three-stage firing cycle were more likely responsible for the external appearance of decorated finewares instead of an intentional choice in the use of paints with specific chemical composition. The presence of bichrome skyphoi noted after MGII-LGIa in Chapter 6 is a paradox that warrants further investigation and targeted SEM-EDX analysis. For bichrome vessels, it is likely that these effects were produced by the application of paint in layers of varying thickness along the vessel’s walls; alternatively, post-depositional deterioration may be responsible for this phenomenon.
Conclusions of microscopic analysis
The present microscopic project on 17 Geometric and Orientalising sherds from the Athenian Agora verifies that the fabric characterisations obtained through macroscopic examination (Hand Specimen) are identical to those obtained by more sophisticated microscopic techniques (T.S.A. and S.E.M.). According to all analyses, Athenian finewares were made from the same fabric across three centuries (9th-7th centuries BC), resulting in two similar variants, differentiated by their coarse tempers and calcareous content. Both variants were common in the local clay beds, while technological choices must have varied according to the quarrying and levigating strategies employed by potters or workshops.
According to previous studies (Jones et al. 1986, 168), analytical tests on Attic vessels indicate that different clays and procedures were employed over time and by ceramic type. Furthermore, experimentation with fabrication techniques became popular in the Early Archaic period, and fabrics were standardised by the Classical era (Gautier 1975, 55-6). Liddy (1996, 489) points to the direction in which experimentation might already have begun towards the end of the Middle Geometric period, particularly regarding the use of calcareous clays.
The present study could not prove the popularity of experimentations in the levigation or fabrication of clays between Early Geometric and Protoattic times, at least in relation to the production of finewares. By contrast, all samples were found to be similar under thin section. There are some variants containing lime-quartz or iron-quartz agglomerates; however, these cannot be regarded as products of conscious experimentation. The only difference of significant importance observed under SEM-EDX relates to the concentrations of CaO in each sample. Again, the presence of sherds with varying concentrations of CaO in their fabrics does not follow any specific chronological or typological pattern.
Although Gautier (1975) ties the use of ‘mixed’ fabrics to the production of fine Dipylon-style vessels, this observation must be expanded: such fabrics were also used in the production of other Geometric and Orientalising wheel-made decorated pots. Despite the symbolic or ceremonial role of such vessels in feasting and Attic burial rites, it is worth noting that vessels with practical functions, such as early SOS transport amphorae, were also made from the same fine fabric.
The existence of deliberate clay-mixing strategies based on potters’ conscious technological choices cannot be proven or ruled out. It is more likely that such ‘clay-mixtures’ were naturally present in the local clay beds. If there were any technological choices involved, they would probably have related to quarrying or levigating (clay refinement) strategies.
Finally, SEM-EDX analysis shows that iron-rich clays were used throughout the Geometric and Orientalising periods for the production of decorative paints and coatings. These were produced by refining the original vessel pastes, and their iron oxide content was by far higher than that in the pastes. Colour variations in the decorated areas most likely resulted from firing conditions rather than chemical composition.
The use of iron-rich clays for the production of coatings, slips, and paints cannot be linked to advances in ceramic decoration over time. Potters employed the same levigation techniques to produce iron-rich suspensions from the very Early Geometric, if not earlier. During the popularity of the figurative style in the Late Geometric period (c.760 BC), potters and painters were already using the same recipes. Therefore, stylistic changes are highly unlikely to have caused technological advances in the levigation of paints and coatings. An interesting exception is the Protoattic sample AS1821. Its coating could have resulted from a different levigation procedure, or it might have been produced from a different clay than the sample’s paste. Whatever the case, AS1821 could be the product of some technological experimentation; however, further investigation is necessary through the analysis of a larger number of decorated Protoattic samples.
Notes:
- Illite is a very fine-grained muscovite mica.
- In reality, there is more than one iron oxide that is found in pottery (e.g. FeO, Fe2O3, Fe3O4, etc.), which are not always distinguishable under the SEM. In the current study, Fe2O3 is used conventionally.
- Temperatures are studied through the effect of vitrification, which occurs between 750 C and 800 C, depending on the nature of the clay. Calcareous clays (containing CaO above 6%) show initial vitrification at temperatures between 800 C and 850 C in oxidised conditions, and between 750 C and 800 C in reduced conditions (Maniatis and Tite 1981, 61). Thermomechanical analysis on Geometric test pieces from the Athenian Agora proved that vessels were fired in a range between 700 C and 850 C “regardless of time period, context or fabric colour” (Schilling 2003, 332).